PRODUCT KNOWLEDGE
How Much Energy Does a 5G Macro Base Station Use per Year in Latin America?
Estimate annual site electricity from a defined meter boundary, measured average power and the local effects of traffic, cooling, conversion and source availability.
Updated September 14, 2026
Annual kWh calculation
Approx. 12 minute read
How many kWh does a 5G macro base station use per year?
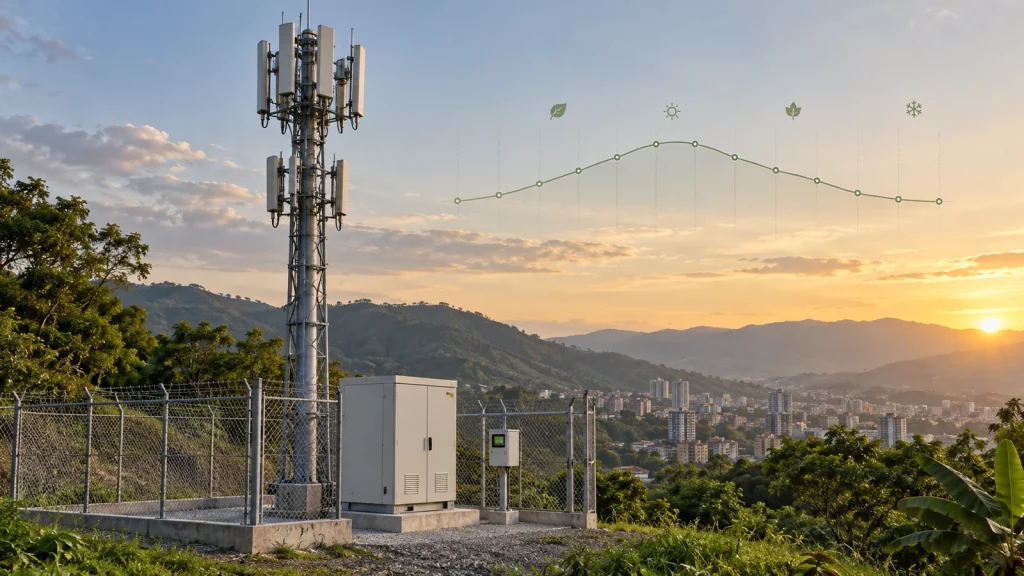 There is no defensible single annual average for every 5G macro site in Latin America. For early screening, a site averaging 3.0 kW at the chosen facility meter uses 26,280 kWh in a 365-day year; 5.0 kW uses 43,800 kWh; and 8.0 kW uses 70,080 kWh. These are transparent calculation cases, not regional benchmarks.
Annual site energy (kWh/year) = average site power (kW) × 8,760 hours/year
Use 8,784 hours for a leap year and keep the meter boundary identical for the power input and the reported energy result.
The phrase 5G energy consumption is often attached to a radio specification, a whole cabinet, a tower compound or a utility bill as if those values were interchangeable. They are not. A useful annual figure states what equipment is included, where energy is measured, whether the value is an average or nameplate rating, and which operating period it represents.
| Illustrative screening case |
Average total site input |
Daily energy |
Annual energy |
How to use it |
| A |
3.0 kW |
72 kWh/day |
26,280 kWh/year |
Low-load boundary check; replace with measured or released design data |
| B |
5.0 kW |
120 kWh/day |
43,800 kWh/year |
Mid-case budget and sensitivity model |
| C |
8.0 kW |
192 kWh/day |
70,080 kWh/year |
Higher-load case for capacity and source checks |
Do not label case B “typical” unless a representative fleet dataset supports that label. A three-sector site with one radio layer, passive or low-duty cooling and modest traffic is not comparable with a multi-band, multi-tenant site that carries legacy equipment, active cooling and edge computing. The same multiplication is valid for both; the average input is not.
The regional context is moving quickly. The GSMA Mobile Economy Latin America 2026 projects 5G to represent 50% of the region’s mobile connections by 2030. That supports the need for current power planning, but it does not publish a universal kWh-per-macro-site value. Deployment forecasts and site energy measurements answer different questions.
What must be included in the base-station energy boundary?
For a complete site-consumption answer, include radio and baseband equipment, transport, rectifier or conversion losses, battery charging losses, cooling, monitoring, security and other continuously supplied auxiliaries inside the selected facility boundary. If the question is only about radio equipment, report that narrower DC or equipment boundary explicitly and do not call it total site consumption.
A practical macro site power model separates four boundaries before any calculation:
- Radio equipment boundary: remote or active antenna units, baseband or distributed units and associated radio functions.
- Telecom load boundary: radio equipment plus backhaul, routers, synchronization and other network devices.
- Total site facility boundary: telecom loads plus rectifiers, battery-path losses, cooling, lighting, monitoring, security and site auxiliaries.
- Purchased-energy boundary: utility electricity recorded at the revenue meter after accounting for any on-site generation, storage exchange or shared tenants.
The 2026 revision history of ITU-T L.1331 provides a current measurement framework for operational mobile networks. It distinguishes base-station energy, backhaul and site infrastructure such as rectifiers, batteries and climate equipment, and it requires the network or site under test to be classified and reported. That framework is more useful for this query than treating a market-report power figure as a regional average.
Name both sides of the meter
“5 kW site load” is incomplete. State whether the meter is on the utility AC input, generator output, rectifier DC output, battery branch or radio feed. A loss that sits upstream of the meter is excluded; a loss downstream is included.
How should annual consumption be calculated from measured data?
Use a full year of interval energy from the total site boundary whenever it is available. Sum valid kWh intervals, identify gaps and source changes, and divide the final annual kWh by the valid hours only when an average kW value is needed. A 15-minute or hourly series is far more useful than one instantaneous clamp-meter reading because traffic and cooling duty vary through the day and season.
Interval method: annual energy = Σ (average interval power × interval duration)
Meter method: annual energy = closing cumulative kWh − opening cumulative kWh, adjusted only for documented resets, meter changes and invalid periods.
Consider a hypothetical site with 45,552 kWh of valid facility-meter energy across 8,760 hours. Its measured average input is 5.20 kW. A 30-day sample at the same average would contain 3,744 kWh, but multiplying that sample by 12 is reliable only if the sample represents the site’s annual mix of traffic, ambient temperature, cooling duty and outage behavior.
| Required record |
Why it matters |
Minimum review |
| Cumulative and interval kWh |
Establishes total energy and reveals gaps or abrupt changes |
Meter ID, timestamp, interval length, time zone and reset history |
| Average and peak kW |
Separates energy budgeting from converter and feeder capacity |
Demand interval, coincident peaks and meter boundary |
| Radio configuration and traffic |
Explains changes in active carriers, layers and load state |
Band, sector, radio model, software mode and traffic period |
| Cooling status and temperature |
Explains seasonal and daytime auxiliary demand |
Ambient and cabinet temperature, setpoint, duty and alarm periods |
| Grid, generator, PV and battery states |
Prevents source transitions from being mistaken for load changes |
Source energy counters, generator runtime and battery charge/discharge state |
If only DC-load data exists, do not add a generic percentage for every missing load. Meter the AC auxiliaries and conversion input where possible. Otherwise, build a traceable estimate from released efficiency curves, actual converter loading, cooling duty, monitoring load and defined uncertainty bands. Nameplate ratings are capacity limits, not annual averages.
Why does the Latin American location change the annual result?
Latin America changes the result through local climate, altitude, radio traffic, site sharing, grid behavior and equipment architecture—not through one regional multiplier. The same 5G radio configuration can produce different facility kWh when enclosure solar gain, cooling runtime, air density, source cycling or tenant load changes.
For Latin American sites, country and city names are still too broad for an energy model. Record the site’s coordinates, elevation, hourly ambient conditions, solar exposure, enclosure construction, cooling control, grid history and traffic profile. Coastal lowlands, tropical interiors, high-altitude cities and temperate southern locations require different assumptions.
| Site condition |
Possible energy effect |
Evidence to collect |
| Hot, humid or high-solar-gain location |
Longer cooling operation, lower condenser margin and more heat entering an exposed enclosure |
Hourly ambient temperature, cabinet temperature, solar exposure, cooling input and duty cycle |
| High-altitude Andean location |
Cooler ambient may reduce cooling demand, while lower air density can affect fan heat transfer and equipment derating |
Elevation, air-cooling design basis, manufacturer derating data and measured temperatures |
| Dense urban traffic or added radio layers |
Higher average radio activity and more equipment may increase the telecom load |
Sector and band configuration, active carriers, traffic counters and measured DC load |
| Shared tower or multi-tenant compound |
A common utility meter may include loads that do not belong to one base station |
Tenant submetering, one-line diagram and allocation rule |
| Weak or intermittent grid |
More battery cycling, generator operation and conversion may change source energy and losses |
Grid availability, outage duration, source counters, charge energy and generator output |
| Salt, dust or restricted maintenance access |
Fouled heat exchangers or filters can change thermal performance over time |
Inspection condition, pressure or airflow evidence, cleaning history and cooling trend |
Do not infer higher total consumption from hot weather alone. A modern outdoor radio arrangement with passive heat rejection may use less facility energy than an older shelter in a cooler city. Architecture and controls can outweigh the climate label, which is why the annual estimate must preserve both site conditions and equipment configuration.
Is annual site consumption the same as grid electricity purchased?
No. Total site consumption describes energy used inside a defined facility boundary, while grid electricity purchased describes one external source. At a hybrid site, PV, grid and generator output may all serve the load; the battery shifts energy in time and adds charge-discharge losses but is not an independent primary energy source.
Keep annual site energy in separate ledger columns:
| Ledger quantity |
Unit |
Do not confuse it with |
| Total facility consumption |
kWh/year at the chosen site boundary |
Utility bill only |
| Grid import |
kWh/year at the utility meter |
Total load when PV or generator supplies energy |
| PV delivered energy |
kWh/year at a named DC or AC point |
PV nameplate multiplied by sunshine hours without losses or curtailment |
| Generator electrical output |
kWh/year at the generator meter |
Fuel litres or an assumed fuel-to-kWh conversion |
| Battery charge and discharge |
kWh/year at named battery or bus points |
Additional net generation |
Reconcile these columns over the same timestamps. Battery state of charge can rise while the utility meter reports higher power because the source is serving both the live load and recharge. During discharge, utility import may fall to zero while the site continues consuming energy. Summing grid input and battery discharge without handling the earlier charge energy will double count part of the energy flow.
Which assumptions move the annual kWh estimate most?
Any sustained change in average power moves annual energy directly: 0.1 kW maintained across a 365-day year changes the result by 876 kWh; 1.0 kW changes it by 8,760 kWh. This simple sensitivity is useful for testing cooling duty, added radio layers, rectifier losses and continuously powered auxiliary loads before detailed simulation.
| Change in annual average input |
Annual energy change |
Example interpretation |
| +0.10 kW |
+876 kWh/year |
Small always-on auxiliary or accumulated conversion difference |
| +0.50 kW |
+4,380 kWh/year |
Continuous-equivalent cooling or added equipment load |
| +1.00 kW |
+8,760 kWh/year |
Material radio, tenant, cooling or edge-load addition |
| −0.40 kW |
−3,504 kWh/year |
Illustrative verified reduction in average load after an approved change |
The last row is arithmetic, not a promised saving. To claim an efficiency improvement, compare matched operating periods and retain the radio configuration, traffic, temperature, outages and source state. The telecom cabinet cooling guide owns cooling-method selection, while the energy management guide owns source priority, battery reserve and fallback logic.
How should a 5G macro site’s annual kWh be validated?
Validate the result by reconciling interval and cumulative meters, checking time coverage, comparing independent source records and explaining changes against traffic, configuration, climate and operating events. An annual total without a data-quality statement is a number, not an engineering baseline.
- Freeze the boundary. Attach the one-line diagram, meter ID, current-transformer ratio where applicable and a list of included loads.
- Check time integrity. Confirm time zone, daylight-saving treatment, leap-year hours, duplicate intervals, missing intervals, clock resets and meter replacement.
- Separate zero from unavailable. A communications gap must not be stored as zero consumption, and a grid outage must not imply zero facility load when storage or a generator carried the site.
- Reconcile totals. Compare interval sums with cumulative meter changes and utility, PV or generator records over matched dates.
- Explain step changes. Record radio additions, software energy-saving changes, cooling maintenance, tenant changes and meter-boundary modifications.
- Publish uncertainty. Identify estimated intervals, missing auxiliary loads, meter accuracy and any allocation assumptions for a shared site.
For fleet comparison, group sites only after normalizing the decision context. A rural coverage site, dense urban capacity site and shared tower can all be efficient for their duty while reporting very different total kWh. Use traffic, coverage, equipment and site-infrastructure metrics alongside raw consumption; do not turn the lowest annual kWh into a universal performance target.
Annual kWh is an input, not a solar or battery size
A yearly consumption figure can support budgeting and an initial energy balance, but it cannot define PV power or battery autonomy by itself. Source sizing also needs the hourly load profile, worst-season solar resource, available source windows, conversion efficiency, autonomy target, battery temperature and ageing assumptions, generator rules and recovery requirement.
The base station electricity total must therefore be converted back into a time series before storage and source decisions are released. Two sites can each consume 43,800 kWh/year: one may hold near 5 kW continuously, while another may alternate between a 3 kW night load and much higher daytime traffic and cooling peaks. They have the same annual energy and different converter, battery and PV requirements.
Use the telecom solar power systems guide for the full source-to-load architecture, and the cellular tower application page for macro-site power planning by grid condition. This article owns the narrower annual-consumption calculation.
Require a common input and result schedule so every bidder calculates the same boundary and operating year. At minimum, request:
- site coordinates, elevation, enclosure or shelter arrangement and hourly design climate source;
- sector, band, radio, baseband, transport and tenant equipment schedule with operating modes;
- measured DC and AC load profiles, meter locations, interval length and valid-data coverage;
- cooling type, ratings, control setpoints, measured duty and maintenance condition;
- rectifier and converter configuration, efficiency evidence at expected loading and redundancy state;
- grid, PV, generator and battery one-line diagram with source-specific energy counters;
- annual kWh result, average and peak kW, uncertainty, exclusions and growth allowance shown separately;
- the calculation workbook or model revision, assumptions, reviewer and method for replacing estimates with commissioned measurements.
Engineering boundary
The 3.0, 5.0 and 8.0 kW cases in this article are illustrative arithmetic, not Huijue product ratings, regional averages or guaranteed project consumption. Final values require the released radio configuration, site architecture, climate basis and measured or approved load data.
Turn the annual kWh estimate into a site power model
Send the radio and auxiliary load profile, meter boundary, climate location, cooling method, grid history, available sources and autonomy target. Huijue can help organize them into a project-specific annual energy balance for technical review.
Submit the site energy inputs