AFRICA MARKET ANALYSIS
Solar Energy Storage for Telecom Micro-Sites in Africa: A 2026 Buyer’s Market Screen
Market evidence, investment filters and a transparent 1 kW sizing model for operators, tower companies, EPCs and energy-service providers evaluating African telecom micro-sites.
Updated August 3, 2026
Buyer, towerco and project-development guide
Approx. 14-minute read
Solar energy storage for telecom micro-sites in Africa has a strong technical role, but the investable market is narrower than the technical need. The best candidates combine a verified low or moderate load with costly or unreliable conventional energy, enough usable solar area, a serviceable site boundary and an owner who captures the fuel, maintenance or availability benefit.That conclusion is deliberately different from saying that every uncovered community needs an off-grid solar tower. Africa’s remaining mobile broadband coverage gap is much smaller than its usage gap. Many people who are offline already live within network coverage, so affordability, devices, skills and relevant services matter alongside new infrastructure. A buyer should therefore screen locations and installed sites before selecting equipment.This article is a market and pre-feasibility tool. For the regional engineering options, environmental conditions and typical source arrangements, use the separate Africa mobile telecom solar solution framework. Keeping those two jobs separate reduces an important SEO and procurement problem: a market analysis should decide where to investigate, while a solution page should explain how a qualified site can be served.
What Counts as a Telecom Micro-Site Here?
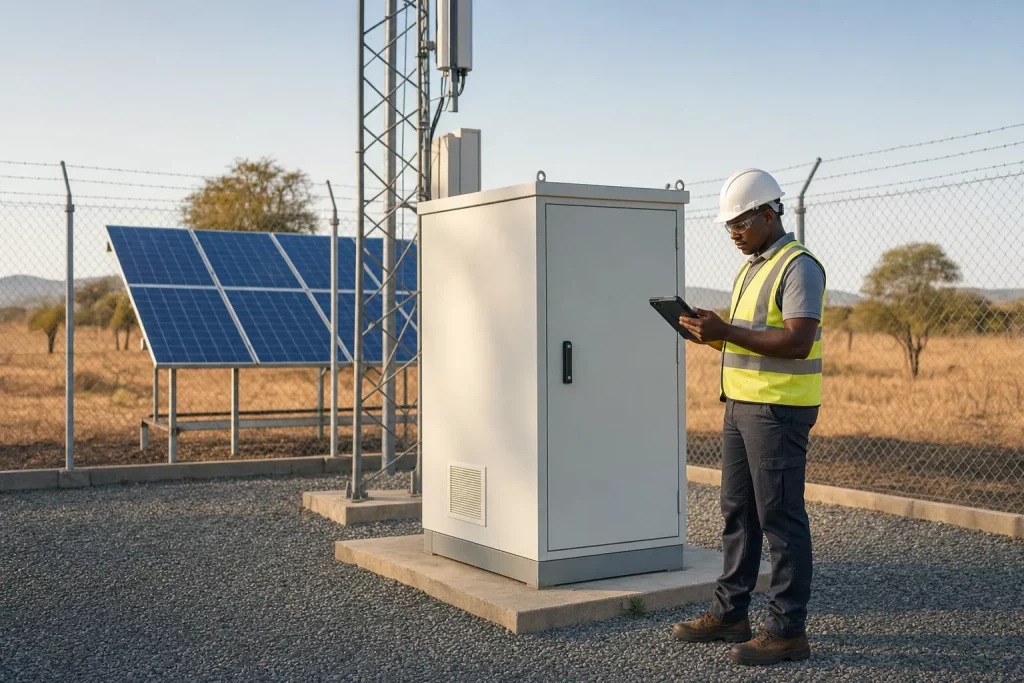 “Micro-site” is an operational category in this analysis, not a universal kilowatt limit. It may describe a rural BTS, repeater, compact backhaul node, private-network point or lightly loaded coverage site whose energy demand and physical footprint are materially below a multi-tenant macro tower.
The label is less important than the system boundary. A quoted 1 kW radio load can become a much larger site load after microwave transmission, DC conversion, ventilation or cooling, security equipment, aviation or area lighting and battery losses are included. Conversely, a network may approve a lower emergency load than its normal busy-hour demand. Both figures belong in the energy model.
For market screening, record five numbers before calling a site “small”:
“Micro-site” is an operational category in this analysis, not a universal kilowatt limit. It may describe a rural BTS, repeater, compact backhaul node, private-network point or lightly loaded coverage site whose energy demand and physical footprint are materially below a multi-tenant macro tower.
The label is less important than the system boundary. A quoted 1 kW radio load can become a much larger site load after microwave transmission, DC conversion, ventilation or cooling, security equipment, aviation or area lighting and battery losses are included. Conversely, a network may approve a lower emergency load than its normal busy-hour demand. Both figures belong in the energy model.
For market screening, record five numbers before calling a site “small”:
- Average delivered load over a representative period.
- Peak load and any starting or short-duration demand.
- Daily delivered energy, including auxiliary equipment.
- Approved load growth during the commercial evaluation period.
- Minimum service load that network operations will permit during an energy emergency.
This boundary avoids a common purchasing error. A compact radio cabinet does not guarantee a compact power plant, and a low average load does not remove the need to check peak current, recharge power and environmental derating.
The 2026 Market Signal: Real Demand, but Not One Addressable Market
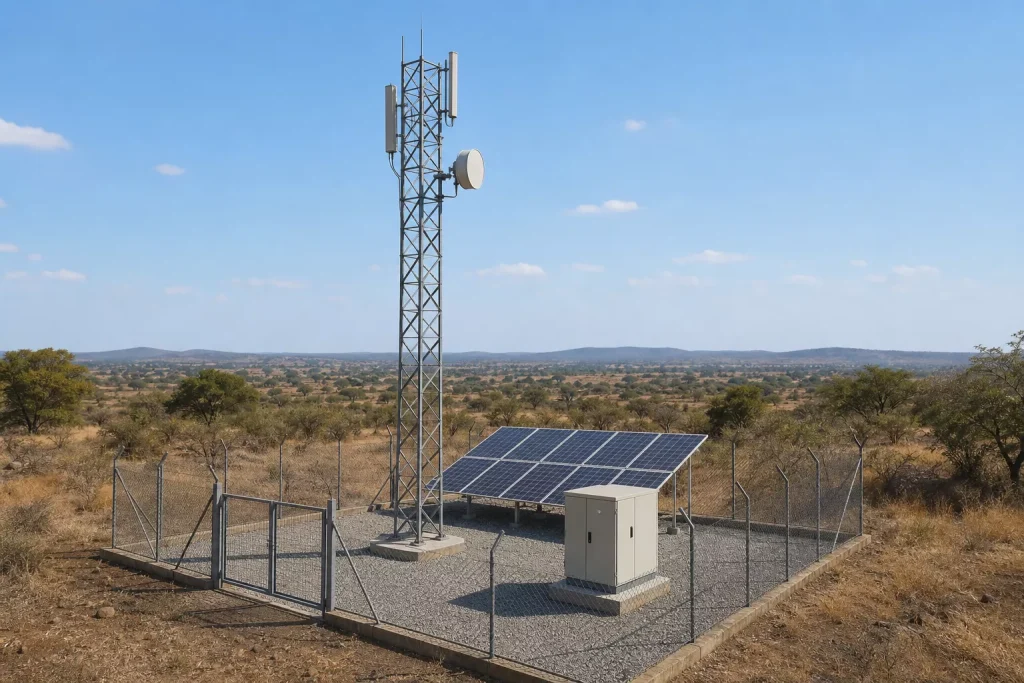 The GSMA Mobile Economy Africa 2026 reports that approximately 9% of Africa’s population remained outside mobile broadband coverage, while about 63% lived within coverage but did not use mobile internet. It also expects mobile operators to invest more than USD 76 billion in African network infrastructure between 2024 and 2030.
Those figures establish a continuing infrastructure market, but they also impose discipline. The 9% is not a tower-order percentage. Terrain, settlement density, spectrum, backhaul, affordability and expected revenue determine how much new radio infrastructure is commercially supportable. Solar energy storage competes for the energy portion of those projects; it does not solve the whole connectivity problem.
Installed networks create a second, often more immediate opportunity. The GSMA 2025 network coverage and infrastructure analysis found that base stations, backhaul and energy supply together account for more than 90% of the annualised cost of a rural deployment in low- and middle-income markets. Where grid service is poor, energy can represent around one-third of operating cost, while average rural-site revenue can be ten times lower than urban-site revenue. In rural Sub-Saharan Africa, only about one quarter of mobile sites were powered directly by grid electricity; the remainder were off-grid, bad-grid or connected to a mini-grid.
This is why brownfield energy work matters. A site does not need to be new to become a solar-storage prospect. High generator hours, repeated battery replacement, weak-grid cycling, expensive fuel delivery or avoidable field visits can justify a retrofit screen even where network coverage already exists.
The clearest published greenfield signal is the January 2025 Orange and Vodacom announcement for the Democratic Republic of Congo. The companies proposed up to 2,000 solar-powered 2G and 4G base stations over six years, beginning with an initial 1,000-site commitment. The operator announcement also says completion remained subject to administrative, regulatory and competition approvals. It demonstrates a viable deployment model and real operator intent. It is not a standard bill of materials for the continent.
Broader energy data explains the operating context without defining telecom demand. The IEA’s World Energy Investment 2025 analysis for Africa states that about 600 million people still lacked electricity access. It also reports that private clean-energy investment rose from around USD 17 billion in 2019 to almost USD 40 billion in 2024 and that solar PV had become the least-cost power source in many African countries. These are useful directional facts. They do not prove a telecom project’s payback or create an authoritative Africa-wide telecom micro-site storage market size.
The GSMA Mobile Economy Africa 2026 reports that approximately 9% of Africa’s population remained outside mobile broadband coverage, while about 63% lived within coverage but did not use mobile internet. It also expects mobile operators to invest more than USD 76 billion in African network infrastructure between 2024 and 2030.
Those figures establish a continuing infrastructure market, but they also impose discipline. The 9% is not a tower-order percentage. Terrain, settlement density, spectrum, backhaul, affordability and expected revenue determine how much new radio infrastructure is commercially supportable. Solar energy storage competes for the energy portion of those projects; it does not solve the whole connectivity problem.
Installed networks create a second, often more immediate opportunity. The GSMA 2025 network coverage and infrastructure analysis found that base stations, backhaul and energy supply together account for more than 90% of the annualised cost of a rural deployment in low- and middle-income markets. Where grid service is poor, energy can represent around one-third of operating cost, while average rural-site revenue can be ten times lower than urban-site revenue. In rural Sub-Saharan Africa, only about one quarter of mobile sites were powered directly by grid electricity; the remainder were off-grid, bad-grid or connected to a mini-grid.
This is why brownfield energy work matters. A site does not need to be new to become a solar-storage prospect. High generator hours, repeated battery replacement, weak-grid cycling, expensive fuel delivery or avoidable field visits can justify a retrofit screen even where network coverage already exists.
The clearest published greenfield signal is the January 2025 Orange and Vodacom announcement for the Democratic Republic of Congo. The companies proposed up to 2,000 solar-powered 2G and 4G base stations over six years, beginning with an initial 1,000-site commitment. The operator announcement also says completion remained subject to administrative, regulatory and competition approvals. It demonstrates a viable deployment model and real operator intent. It is not a standard bill of materials for the continent.
Broader energy data explains the operating context without defining telecom demand. The IEA’s World Energy Investment 2025 analysis for Africa states that about 600 million people still lacked electricity access. It also reports that private clean-energy investment rose from around USD 17 billion in 2019 to almost USD 40 billion in 2024 and that solar PV had become the least-cost power source in many African countries. These are useful directional facts. They do not prove a telecom project’s payback or create an authoritative Africa-wide telecom micro-site storage market size.
| Published signal |
What it supports |
What it does not prove |
| 9% mobile broadband coverage gap |
Selective need for new coverage in underserved locations |
That 9% more towers or solar systems will be purchased |
| 63% usage gap |
Network economics depend on affordability and adoption, not coverage alone |
That additional radio infrastructure will close the gap |
| More than USD 76 billion expected operator investment, 2024-2030 |
A substantial regional network-capex pipeline |
The share available to micro-sites, energy storage or one supplier |
| Only one quarter of rural Sub-Saharan African sites directly grid-powered |
A large installed base exposed to off-grid and bad-grid energy problems |
That every non-grid site should use the same hybrid architecture |
| Up to 2,000 proposed solar base stations in the DRC |
A concrete solar-first rural deployment model |
A continent-wide order forecast or approved final rollout |
Four Opportunity Classes Worth Screening
The useful first question is not which battery to quote. It is which sites deserve engineering time. Four classes recur, but each requires different evidence.
| Candidate class |
Evidence that earns a closer review |
Primary economic lever |
Early warning sign |
| Deep-rural greenfield coverage |
Approved coverage objective, credible traffic case, defined backhaul and no practical grid extension |
Avoided grid construction and routine fuel logistics |
The radio plan, land access or backhaul remains unsettled |
| Diesel-led brownfield site |
Metered generator hours, fuel records, maintenance history and known load |
Reduced generator runtime, fuel delivery and engine service |
Fuel consumption cannot be reconciled with runtime and load |
| Weak-grid cycling site |
Timestamped outage and voltage-quality data, battery events and recharge history |
Better use of available grid energy and fewer outage failures |
The tender describes the grid as “unreliable” without measurements |
| Compact critical site |
Defined service consequence, backup policy and constrained installation boundary |
Availability and reduced emergency dispatch |
PV area, wind loading, shade or safe access has not been surveyed |
Country names alone are poor filters. A coastal site in Mozambique, a high-altitude site in Ethiopia and a dense rooftop site in Lagos can have less in common with one another than with sites on different continents. Segment by the energy problem first, then apply country regulation, climate, import, currency and service-chain constraints.
The same rule applies to market ranking. A country with a large uncovered population can present strong technical need but difficult financing, foreign-exchange or logistics. A mature market may add fewer towers but fund better brownfield resilience. A supplier pipeline should therefore separate potential site count from bankable procurement.
Who Owns the Energy Benefit?
A technically sound retrofit can fail commercially when the party paying for equipment does not receive the saving. Before calculating payback, identify the energy counterparty and the contract boundary.
| Commercial model |
Who normally funds the power asset? |
What must be measured? |
Typical decision tension |
| Operator-owned site |
Mobile network operator |
Energy, availability, generator use and network-service impact |
Energy capex competes with radio and spectrum investment |
| Towerco site |
Tower company, sometimes with pass-through charges |
Tenant load, energy supplied, service-level events and expansion |
One tenant may drive an upgrade while several tenants benefit |
| Energy-as-a-service |
ESCO or specialist power provider |
Delivered energy, agreed availability, fuel baseline and exclusions |
Performance risk and data access must be allocated in the contract |
| EPC-led greenfield project |
Operator, towerco, government programme or development-funded buyer |
Acceptance performance and complete installed scope |
Low first cost can conflict with lifecycle serviceability |
For example, a towerco that is reimbursed for fuel may not benefit from lower diesel consumption unless the commercial model changes. An operator buying power as a service may care more about availability and tariff than the equipment mix. The bill of materials can be identical while the investment decision is completely different.
Define the baseline owner, saving owner, data owner and failure-risk owner in the same worksheet. If those four roles are unclear, a precise battery calculation will not rescue the business case.
Worked Screen: A Constant 1 kW Telecom Micro-Site
This example is a pre-feasibility calculation, not a quotation or construction design. It shows how assumptions move through the arithmetic so that a buyer can challenge them. Detailed sizing should follow a measured load and the site coordinates; the related telecom solar and battery sizing guide covers the full engineering workflow.
| Input |
Illustrative value |
Replacement required for a real project |
| Continuous delivered site load |
1.0 kW for 24 hours |
Interval load profile, peak and planned growth |
| Design peak-sun hours |
4.0 hours |
Coordinates and the lowest relevant design period |
| PV-side derating factor |
0.78 |
Temperature, soiling, mismatch, wiring and MPPT model |
| Downstream energy-path efficiency |
0.88 |
Actual DC and AC conversion path |
| Planning allowance |
15% |
Separate growth and uncertainty allowances |
| Battery autonomy |
12 hours |
Approved service and recovery policy |
| Battery factors |
80% DoD, 93% discharge efficiency, 80% end-of-life retention |
Exact product data, temperature and warranty conditions |
PV screening calculation
Daily delivered energy is:
1.0 kW × 24 h = 24 kWh/day
Allowing for the downstream energy path and the planning allowance:
24 kWh ÷ 0.88 × 1.15 = 31.4 kWh/day required from the PV side
The preliminary PV rating is:
31.4 kWh ÷ (4.0 h × 0.78) = 10.1 kWp
Battery screening calculation
Twelve hours at 1.0 kW requires 12 kWh delivered to the site. The preliminary initial nameplate energy is:
12 kWh ÷ (0.80 × 0.93 × 0.80) = 20.2 kWh
This is not yet an equipment selection. The design must still check current, module rounding, reserve state of charge, temperature, protection, recharge time, low-sun sequences and the interaction between load growth and end-of-life capacity.
The Result Is More Sensitive Than One Number Suggests
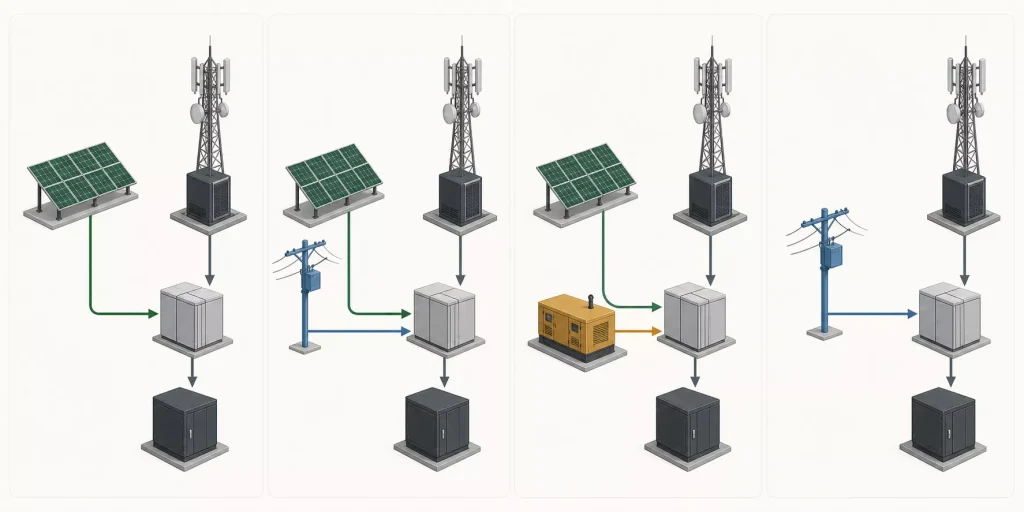 A single worked answer can look authoritative while hiding the assumptions that control it. Two small sensitivity tables reveal more.
| Design peak-sun hours |
Preliminary PV rating |
Interpretation |
| 3.5 h |
11.5 kWp |
Lower-resource design period requires more array area |
| 4.0 h |
10.1 kWp |
Base screening case |
| 4.5 h |
8.9 kWp |
Better design-period resource reduces preliminary rating |
| 5.0 h |
8.0 kWp |
Should not be used unless site and seasonal data support it |
| Autonomy at 1.0 kW |
Delivered energy |
Preliminary initial nameplate storage |
| 8 hours |
8 kWh |
13.4 kWh |
| 12 hours |
12 kWh |
20.2 kWh |
| 24 hours |
24 kWh |
40.3 kWh |
These rows change only one input at a time. Real conditions interact. Lower solar resource can extend battery cycling and delay recharge. High temperature can reduce conversion efficiency, usable battery energy and life. A 20% load increase raises daily energy, PV requirement and storage demand together. Hourly state-of-charge simulation is the next step because daily totals cannot show whether the battery reaches a damaging minimum before the source recovers.
Screening rule: do not use a national annual solar average to size a telecom micro-site. Use coordinates, the relevant low-resource period and the required recovery deadline. Annual energy can balance while the site still fails during a short sequence of poor days.
Build the Business Case From the Existing Site Outward
The baseline should be reconstructed before the hybrid design is priced. For a diesel-led site, use actual fuel volume, delivered fuel cost, generator runtime, service history, theft or loss policy and field-dispatch cost. For a weak-grid site, include purchased energy, outages, battery cycling and the hours in which the grid can recharge storage.
Annual baseline cost = purchased energy + delivered fuel + planned engine service + battery replacement reserve + expected fault dispatch + agreed outage exposure
Annual proposed cost = remaining grid and fuel + system service + battery replacement reserve + communications and software support + expected fault dispatch + finance cost
Avoided cost is the difference between comparable boundaries. Do not count fuel transport twice if it is already embedded in the delivered fuel price. Do not assign a cash value to better availability unless the operator, towerco or service contract defines that value. Carbon reduction can be reported separately from cash saving unless it produces a contractual credit or compliance benefit.
Use at least three scenarios:
- Measured base case: best available load, fuel, grid and service records.
- Adverse operating case: lower solar yield, slower repair access, battery ageing and higher load.
- Commercial stress case: currency movement, delayed import, financing cost and weaker-than-expected fuel saving.
Simple payback can remain in the summary, but the approval file should also show battery replacement timing, residual generator maintenance, service obligations and who carries underperformance. A short payback produced by an optimistic fuel baseline is not a conservative project.
When Solar-First Should Not Pass the First Screen
Market enthusiasm is not a reason to force the architecture. Pause or reject the solar-first case when one or more of these conditions remain unresolved:
- The grid is stable and inexpensive, and the site needs only a clearly defined backup interval.
- Usable PV area is too small, shaded, structurally unsuitable or unsafe to service.
- The site load is unmeasured, disputed between tenants or expected to change before commissioning.
- Land, security, flood, wind or theft exposure makes the proposed array and cabinet boundary impractical.
- The battery cannot recover before the next credible outage or poor-solar interval.
- The site is scheduled for consolidation, relocation or radio replacement before the energy investment can earn its case.
- The party funding the project cannot retain the energy or maintenance saving.
- No local organisation accepts responsibility for alarms, spares, software access and physical repair.
This does not mean the site receives no energy improvement. It may justify efficient rectifiers, a focused battery reserve, generator-control changes or a smaller PV contribution instead of a nominally independent solar plant. Rejecting an oversized concept can be a better engineering outcome than forcing every candidate into one portfolio package.
Use Three Gates Before Scaling a Portfolio
Portfolio standardisation should be the result of evidence, not the opening assumption.
Gate 1: prove the data
Reconcile interval load, generator runtime, fuel, grid events and alarm history. Confirm the site boundary and ownership model. A month of clean data is often more useful than a year of inconsistent spreadsheets, although seasonal networks require a longer view.
Gate 2: prove the operating sequence
Model the lowest relevant solar period, reserve policy, source priority, battery recovery and load growth. At factory and site acceptance, interrupt sources, isolate a battery branch, remove the remote data path and verify black start. Record voltage, current, state of charge, alarms and transition time rather than accepting a dashboard screenshot.
Gate 3: prove repeatability
Run the pilot through a representative adverse period. Compare measured PV yield, generator hours, battery temperature, recharge time, truck rolls and service availability with the approved model. Then classify the next sites by load, source condition, environment, access and physical layout. Exceptions should remain visible instead of being hidden inside a standard package.
| Pilot KPI |
Why it matters |
Evidence needed for scale-up |
| Delivered load and energy |
Confirms the system boundary and growth assumption |
Time-series data, not a single meter reading |
| PV yield by design period |
Tests the resource and derating model |
Measured generation compared with weather and soiling records |
| Battery minimum SoC and recovery time |
Shows whether reserve is both adequate and restorable |
Event traces across representative low-energy periods |
| Generator starts, hours and fuel |
Measures the main saving at diesel-led sites |
Controller logs reconciled with fuel and service records |
| Alarm-to-action time |
Tests whether monitoring changes field operations |
Timestamped alarm, diagnosis, dispatch and closure records |
| Availability at the agreed service boundary |
Connects energy performance to the telecom obligation |
Operator or towerco service records using an agreed definition |
Huijue can configure PV input, LiFePO4 storage, telecom rectification, DC distribution, source control, outdoor enclosures and remote energy management within this process. The relevant telecom energy products and services should be matched only after the site class and acceptance evidence are defined.
Buyer Questions
Does a 9% coverage gap mean Africa needs 9% more telecom sites?
No. Population coverage is not a tower-count formula. Terrain, population distribution, spectrum, existing networks, backhaul, affordability and expected traffic determine how many sites are technically and commercially justified.
Is the 1 kW example a recommended product size?
No. It is a transparent arithmetic screen. Its 10.1 kWp PV result and 20.2 kWh preliminary battery result depend on the stated solar, efficiency, autonomy, DoD and end-of-life assumptions. Replace every input before requesting a bill of materials.
Is solar always cheaper than diesel at a remote site?
No. The answer depends on load, solar resource, delivered fuel cost, generator efficiency, battery replacement, financing, service capability, security and project life. Solar-storage tends to become more attractive where delivered diesel and repeated field access are expensive, but each baseline must be demonstrated.
Why can a weak-grid site be a better prospect than a no-grid site?
A weak-grid site may already have measured load, access, land, backhaul and an installed revenue stream. Available grid energy can also support recovery. The difficult part is modelling outage distribution and protecting the battery from frequent cycling, not proving that the location can host a network.
Is there a reliable market size for African telecom micro-site solar storage?
No authoritative public source was found that isolates this exact category across Africa with a verified 2026 revenue, unit count or CAGR. Broader telecom investment, coverage, rural-energy and clean-energy figures describe the opportunity context but should not be relabelled as this niche market’s size.
Method, Evidence and Limitations
This analysis was reviewed on August 3, 2026. It uses current GSMA market and network-infrastructure reporting, the IEA’s Africa investment analysis and the Orange-Vodacom DRC announcement. First-party sources are linked beside the claims they support. The worked model uses labelled assumptions and simple engineering arithmetic; it is not based on a customer project and does not replace hourly simulation, electrical design, civil review or local approval.
The analysis does not present an Africa-wide solar-storage market value because the available sources use different boundaries. Operator investment includes much more than site energy. Clean-energy investment includes much more than telecom. A proposed tower programme is not the same as an awarded and commissioned fleet.
The practical next step is not to ask for a standard Africa kit. Choose a small group of candidate sites, reconcile their loads and energy records, identify who owns the saving, and run the sensitivity model against the worst credible operating period.
Screen the site before selecting the cabinet.
Bring the coordinates, interval load, source history, fuel and maintenance records, autonomy requirement, installation boundary and commercial ownership model into one review. The first decision is whether the site deserves a solar-storage feasibility study at all.
Which ten sites in your portfolio have the clearest measured energy problem and the cleanest evidence to test it?