MARKET INTELLIGENCE
Telecom Power System Market Size, Share and Growth Analysis to 2028
A buyer-focused analysis of the USD 4.2 billion to USD 6.6 billion forecast across on-grid, bad-grid and off-grid sites, components, power sources, ratings and regional demand.
Updated July 29, 2026
Global market and buyer analysis
Approx. 14-minute read
Market-data boundary: The headline forecast comes from a study published in July 2023 and updated online in September 2024. Its base year is 2022 and its forecast period is 2023-2028. The figures are a published forecast, not confirmed 2026 market revenue.The short answer: the cited study projects growth from USD 4.2 billion in 2023 to USD 6.6 billion in 2028 at a 9.4% CAGR. Its strongest public segment signals are bad-grid demand, diesel-battery power, generator requirements and continued investment in remote and higher-capacity telecom infrastructure.The global telecom power system market sits behind nearly every mobile call, data session, microwave link and edge application. Radios and transmission equipment receive most of the attention, but they cannot remain available without rectifiers, batteries, controllers, generators, renewable inputs, thermal management and protection.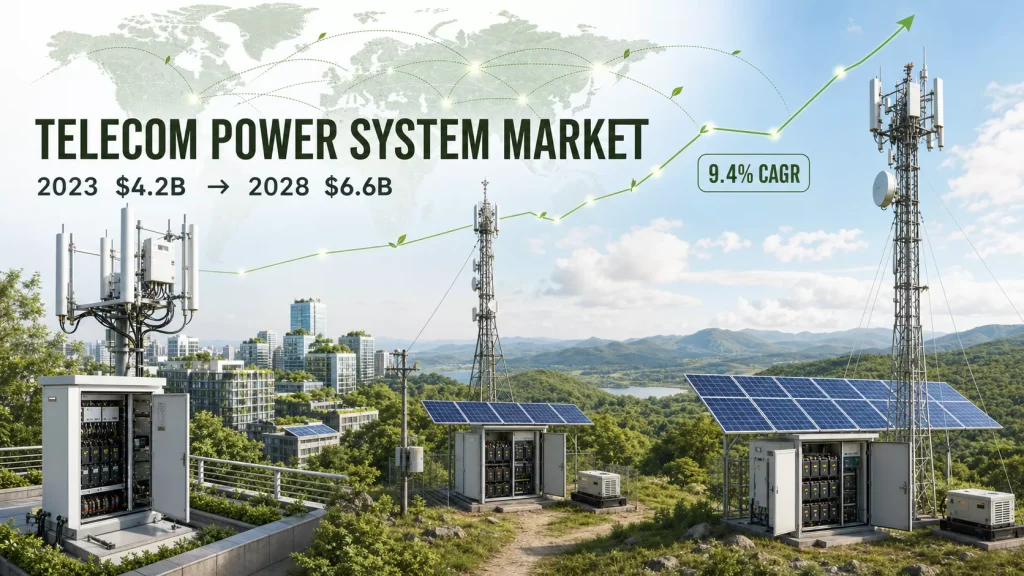 MarketsandMarkets projects that the market will grow from USD 4.2 billion in 2023 to USD 6.6 billion in 2028, representing a compound annual growth rate of 9.4%. Its segmentation covers on-grid, off-grid and bad-grid sites; AC and DC technology; multiple power-source combinations; three power bands; and components ranging from rectifiers to generators and batteries.
The headline is useful, but the more valuable question is what sits underneath it. Growth in a stable-grid urban network does not create the same product demand as rural expansion in a country with weak utility service. This analysis translates the forecast into equipment, site and purchasing implications without treating one market estimate as a certainty.
MarketsandMarkets projects that the market will grow from USD 4.2 billion in 2023 to USD 6.6 billion in 2028, representing a compound annual growth rate of 9.4%. Its segmentation covers on-grid, off-grid and bad-grid sites; AC and DC technology; multiple power-source combinations; three power bands; and components ranging from rectifiers to generators and batteries.
The headline is useful, but the more valuable question is what sits underneath it. Growth in a stable-grid urban network does not create the same product demand as rural expansion in a country with weak utility service. This analysis translates the forecast into equipment, site and purchasing implications without treating one market estimate as a certainty.
Telecom Power System Market Forecast at a Glance
| Forecast item |
Published figure or scope |
How to interpret it |
| 2023 market size |
USD 4.2 billion |
Starting point of the published forecast period |
| 2028 market size |
USD 6.6 billion |
Forecast end value, not a guaranteed outcome |
| 2023-2028 CAGR |
9.4% |
Average compounded path implied by the two end points |
| Base year |
2022 |
Historical base used by the original study |
| Market unit |
Revenue and thousand units |
Revenue can rise because of volume, product mix, service content or price |
| Geographic scope |
North America, Europe, Asia Pacific and rest of world |
Regional demand differs substantially by grid quality and network maturity |
The source and complete segment list are available on the MarketsandMarkets telecom power system market page.
What would the forecast imply for 2026?
If the market followed a perfectly smooth 9.4% annual path from USD 4.2 billion, the mathematical series would look like this:
| Year |
Implied market value |
Status |
| 2023 |
USD 4.20 billion |
Published forecast starting value |
| 2024 |
USD 4.59 billion |
Calculated at constant 9.4% growth |
| 2025 |
USD 5.03 billion |
Calculated at constant 9.4% growth |
| 2026 |
USD 5.50 billion |
Calculated scenario, not a reported actual |
| 2027 |
USD 6.02 billion |
Calculated at constant 9.4% growth |
| 2028 |
USD 6.58 billion |
Rounds to the published USD 6.6 billion forecast |
2023-2028 published forecast path
USD 4.2 billion × (1 + 9.4%)5 ≈ USD 6.58 billion
Real markets rarely move in a smooth curve. Mobile-operator capital expenditure, exchange rates, equipment prices, spectrum awards, rural-coverage obligations and major network contracts can shift revenue between years. The USD 5.50 billion figure is useful for understanding the forecast trajectory, but it should not be quoted as an audited 2026 market size.
What Is Included in a Telecom Power System?
A telecom power system converts available energy into stable power for radios, baseband equipment, transmission, routers, cooling, security and auxiliary loads. It also carries the site through grid interruptions and coordinates generators, solar arrays or batteries where the utility supply is weak or absent.
The market boundary is broader than a rectifier shelf. It may include:
- AC/DC rectifiers and modular DC power shelves.
- DC/AC inverters for air conditioning, lighting and other AC loads.
- DC/DC converters for voltage adaptation and remote-power applications.
- Site and energy controllers, sensors and remote monitoring.
- Battery strings, lithium battery packs and battery management systems.
- Diesel or gas generators and generator-control interfaces.
- Photovoltaic modules, solar charge controllers and wind inputs.
- Power distribution, surge protection, breakers and low-voltage disconnects.
- Heat management, cabinet ventilation and cooling equipment.
Market reports may group these products differently. A generator can be counted as a component, a power source or part of an integrated solution. Batteries and solar modules may appear under “other components” even though they represent a large share of an off-grid project’s hardware cost. Buyers comparing reports should check the definition before comparing market values.
Market Analysis by Grid Type
On-grid telecom power systems
On-grid sites have a utility connection considered sufficiently available for normal operation. The power system still needs rectification, distribution, surge protection and backup. The battery may bridge short interruptions, while a generator supports longer outages at critical macro sites, switching centres and access facilities.
Growth in this segment comes from network expansion, 5G upgrades, replacement of ageing DC plants, higher rack density and resilience requirements. In stable-grid markets, buyers tend to focus on conversion efficiency, compactness, monitoring, battery life and how the system behaves when grid voltage or frequency moves outside its normal range.
Bad-grid telecom power systems
A bad-grid site has a utility connection, but supply is unreliable, limited in duration, unstable or unable to support the full load. The cited market study expects this grid type to hold the largest market size during the forecast period.
These sites put more stress on batteries and controls than conventional standby duty. The battery may cycle every day. A hybrid controller must decide when to use grid power, stored energy, solar generation or a generator. Poor control logic can waste fuel, shorten battery life or cause an outage even when enough energy is physically installed.
For suppliers, bad-grid demand favours modular rectifiers, larger cycling batteries, generator automation, solar-ready inputs and remote energy analytics. For operators, the purchasing decision should be based on annual energy balance and outage distribution, not simply the site’s peak load.
Off-grid telecom power systems
Off-grid sites operate without a usable utility connection. Their energy may come from solar, wind, diesel, batteries or several sources working together. The design must cover seasonal renewable production, worst-case load, battery temperature, fuel logistics, maintenance access and the required autonomy.
Off-grid growth is closely connected to rural and remote coverage. ITU reported that 5G covered 55% of the world’s population in 2025, but only 40% of rural residents versus 66% of urban residents. It also reported that 4G coverage reached 99% in urban areas and 84% in rural areas. These gaps show why new sites are increasingly built where both backhaul and reliable electricity are harder to obtain. The figures can be reviewed in the ITU 2025 mobile network coverage statistics.
| Grid type |
Typical energy architecture |
Main buying criterion |
| On-grid |
Grid, rectifier and battery; generator at selected sites |
Efficiency, backup reliability and integration with the existing NMS |
| Bad-grid |
Unreliable grid, cycling battery, generator and optional solar |
Fuel reduction, battery life and source-control logic |
| Off-grid |
Solar or other generation, battery and generator contingency |
Seasonal energy balance, autonomy and maintainability |
Market Analysis by Component
Rectifiers remain the centre of the DC plant
Telecom loads commonly operate from a nominal -48 V DC system. Rectifiers convert AC input into regulated DC, supply the live load and charge the battery. Demand is driven by new sites, additional radio load, replacement of inefficient modules and the need for higher-density shelves.
Efficiency should be evaluated across the real load range, not only at the best operating point. A lightly loaded rural site and a heavily loaded 5G macro site can favour different module capacities and redundancy arrangements.
Inverters and converters serve changing site loads
Inverters support AC auxiliaries such as conventional cooling, maintenance outlets or legacy equipment. DC/DC converters adapt voltage levels and can support remote radio, small-cell and specialised distribution architectures. Their market opportunity grows as sites combine old and new equipment or move toward more granular DC distribution.
Controllers are gaining value faster than their physical size suggests
The controller decides how the site uses energy and reports what is happening. In hybrid systems it can schedule a generator, limit battery depth of discharge, prioritise solar production and detect abnormal energy consumption. Its commercial value increasingly includes software, protocol integration and fleet analytics rather than only the circuit board.
Open alarm maps, local operation, documented interfaces and controlled firmware are becoming stronger buying criteria. A low-cost controller that locks all operational data into an unsupported cloud can increase lifecycle cost.
Generators remain important, but their operating role is changing
The referenced study expected generators to hold the largest component share from 2023 to 2028 and diesel-battery systems to dominate by power source. That reflects the need for long-duration reliability at remote sites. It should not be read as evidence that operators prefer continuous diesel operation.
In many new designs, the generator moves from primary source to controlled contingency. Solar and batteries carry more operating hours, while the generator covers prolonged poor weather, exceptional load or maintenance. This reduces runtime only when the battery, renewable resource and controller are sized together.
Market Analysis by Power Source
| Power-source combination |
Where it fits |
Main commercial issue |
| Diesel-battery |
Remote sites requiring proven long-duration backup |
Fuel delivery, theft, maintenance and generator loading |
| Diesel-solar |
Sites with useful solar resource and high daytime energy demand |
Solar utilisation without adequate storage |
| Diesel-wind |
Selected locations with measured and dependable wind conditions |
Resource variability and mechanical maintenance |
| Solar-battery-diesel |
Off-grid and bad-grid sites seeking lower fuel use with resilience |
Correct energy sizing and coordinated control |
| Multiple-source microgrid |
Large shared sites, access hubs or isolated facilities |
Integration complexity, protection and ownership boundaries |
Fuel saving is not determined by the presence of solar panels. It depends on the load curve, renewable yield, usable battery energy, generator minimum loading, charge efficiency and dispatch strategy. Market growth in “hybrid power” will therefore reward engineering and monitoring as much as hardware volume.
Market Analysis by Power Rating
Below 10 kW
This range covers many macro cell sites, base transceiver stations, microwave nodes, rural coverage sites and compact edge installations. It is a high-volume segment suited to modular rectifiers, integrated outdoor cabinets and standardised battery blocks. Actual demand varies with radio configuration, cooling and whether several operators share the site.
10-20 kW
Medium-output systems can serve higher-capacity 5G sites, multi-sector configurations, collocated operators or sites with larger auxiliary loads. Buyers need to examine expansion bays, busbar rating, fault current, thermal design and the transition from normal to backup operation.
Above 20 kW
Higher-output systems appear at access and aggregation nodes, large shared towers, switching facilities, data-related telecom rooms and some fibre network sites. These projects carry more engineering and service revenue, but they also require stronger selectivity, redundancy, commissioning and protection coordination.
Power bands are market-report categories, not sizing rules. A nominal 12 kW radio installation may need a different plant after accounting for battery recharge, cooling, inverter losses, future expansion and the required redundancy. Procurement should begin with a measured or engineered load schedule.
AC and DC Technology Trends
DC systems remain fundamental because telecom electronics and batteries naturally fit a DC architecture. They can reduce conversion stages and provide direct battery continuity. AC systems remain necessary for conventional auxiliary equipment, utility interfaces and facilities that combine telecom with broader commercial loads.
The market is not moving toward one universal architecture. It is moving toward coordinated AC and DC systems with better visibility. A site may use AC utility and generator inputs, high-efficiency rectifiers, a -48 V DC bus, an inverter for selected AC loads and DC-coupled solar or battery equipment. The controller and protection design determine whether these parts behave as one system.
Seven Drivers Behind Telecom Power System Industry Growth
- Rural coverage expansion: New sites are moving into areas where grid access, roads and technical support are limited.
- 5G deployment and capacity upgrades: More radios, frequency bands and processing can increase site load even where tower count changes slowly.
- Network resilience: Storms, heat, wildfires, grid congestion and public-safety expectations strengthen the case for backup and remote supervision.
- Diesel-cost pressure: Fuel price, delivery, theft and maintenance make hybridisation attractive at high-runtime sites.
- Renewable integration: Falling solar and storage costs enable more energy to be generated and shifted on-site.
- Battery technology change: Lithium systems provide higher energy density, deeper cycling and more monitoring than conventional standby batteries, though they require suitable protection and thermal design.
- Remote energy management: Operators increasingly need site-level data to find abnormal consumption, predict autonomy and schedule maintenance.
What Could Hold the Forecast Back?
The same industry has meaningful constraints. Operators may delay capital spending during weak economic periods. Currency pressure raises the local cost of imported equipment and fuel. Rural sites can have low revenue per user, while permits, land, backhaul and security add to the business case.
Technical fragmentation is another restraint. Batteries, rectifiers, generators and monitoring platforms may use different protocols or undocumented data maps. Poor integration can erase part of the saving promised by renewable or automated systems. Shortages of trained field technicians, spare parts and reliable service partners are especially important in remote regions.
Environmental restrictions on diesel, tighter product requirements and cybersecurity obligations can raise development and compliance costs. They can also shift demand toward more efficient, traceable and remotely manageable systems.
Regional Growth Will Not Use One Template
| Region |
Likely demand pattern through 2028 |
Supplier requirement |
| North America |
5G capacity, hardening, backup replacement and edge facilities |
Codes, certification, resilience and service response |
| Europe |
Network modernisation, energy efficiency, storage and reduced diesel dependence |
Conformity documentation, cybersecurity, lifecycle efficiency and local support |
| Asia Pacific |
Large network scale spanning dense urban and weak-grid rural markets |
Cost control, modularity, capacity and broad environmental adaptation |
| Middle East |
Heat, remote coverage and high-cooling loads |
Thermal derating, dust protection and robust hybrid design |
| Africa |
Coverage expansion, off-grid and bad-grid energy, and diesel reduction |
Solar-battery engineering, simple maintenance and remote fault visibility |
| Latin America |
4G/5G expansion across mixed grid quality and difficult terrain |
Flexible source integration, corrosion protection and regional service |
MarketsandMarkets expected China to hold the largest share within Asia Pacific during the forecast period. That does not mean Chinese domestic demand represents every APAC project. India, Southeast Asia, developed East Asian markets and Pacific islands have very different grid, climate and procurement conditions.
What the Forecast Means for Manufacturers and Buyers
For manufacturers, the attractive part of this market is not simply producing more rectifier modules. Buyers increasingly want a configured site-energy system: power conversion, storage, renewable input, outdoor protection, monitoring, documentation and support. Product platforms must remain modular enough to fit different grid types without becoming a new engineering project for every tower.
Huijue Group’s telecom solar power and site energy systems address this integration layer through DC power, batteries, hybrid energy control, outdoor cabinets and remote management. Market growth does not prove that any one configuration suits a project. The proposed system still needs site load data, local solar or grid information, certification review and lifecycle-cost comparison.
For buyers, a large CAGR is not a purchase specification. A useful tender should define:
- Hourly or representative load, starting current and future expansion.
- Grid outage frequency, duration, voltage quality and seasonal pattern.
- Required autonomy and acceptable generator runtime.
- Temperature, dust, humidity, corrosion, altitude and security conditions.
- Available solar area and independently checked energy yield.
- Battery usable energy at end of life, not only nameplate capacity.
- Interfaces, alarms, local operation, data ownership and cybersecurity.
- Factory tests, commissioning, spares, training and response time.
How to Use the 2028 Forecast Responsibly
The USD 6.6 billion estimate is best treated as a directional industry scenario. It supports the case that telecom energy will remain a growing equipment and service category. It does not reveal a supplier’s obtainable revenue, a country’s annual order volume or the right technology for one site.
Before using the number in an investment plan, check whether the market definition includes batteries, generators, cooling, renewable generation and services in the same way as your business model. Review newer operator capital-expenditure data, awarded network contracts and local tower counts. Then build separate scenarios for unit volume, average selling price and service revenue.
The more useful decision question is not, “Will the telecom power system market reach USD 6.6 billion?” It is: which grid types, power bands and operating-cost problems can our product or project solve with evidence before 2028?
Buyer reminder: a market CAGR is not a site specification. Validate the load profile, grid quality, autonomy, climate, fuel logistics, certification requirements and service plan before selecting equipment.
Turn a market outlook into a site-specific power design.
Prepare the site load, grid-outage history, autonomy requirement, climate, fuel logistics, available solar area and future capacity before selecting a telecom power architecture. These inputs reveal whether an on-grid backup system, bad-grid hybrid plant or off-grid solar-battery solution is commercially defensible.
Discuss the operating conditions and required evidence with a telecom site energy engineer before fixing the equipment list.